I'll be analyzing a real-world job posting dataset to find insights for DataSearch, a fictional recruiting firm. I'll explore and clean the data with Power Query to see what skills are most in demand for data scientists, analysts, and engineers I’ll then use DAX to build insightful visualizations of my findings. Finally, I’ll bring it all together using everything Power BI has to offer to create a business dashboard so that I can answer questions for the DataSearch team.
Data Analytics Pipeline
- I'll double-check the data's integrity before beginning exploratory data analysis.
- I'll start asking business questions about the issue we'll be addressing.
- For additional investigation, I will employ a variety of visuals as well as some fundamental DAX calculations.
- For our key stakeholders, I'll be developing the visuals in a more intuitive and user-friendly way.
Problem to solve
I'll be working for DataSearch, an employer recruiting agency, to gain insight into data science employment market trends. Recruiters, often known as headhunters, provide employment recruitment services to both companies and job seekers. I'll be given the task of looking for trends in top data science jobs and their associated skills using a dataset of job posts.
Market trends to watch
Job market trends are a typical supply and demand problem. The fundamentals of this notion are crucial to grasp, and we should keep an eye out for them in this case study.
The data
For this case study, I'll use a fictitious dataset made up of job postings in the data science industry during the last five years. Each entry in this dataset's table corresponds to a specific job posting at a certain point in time, with 19 attributes or columns for each posting. Because this dataset is fictitious, we can't apply any of the lessons learned in this case study to the actual world.
The dataset is comprised of both Qualitative and Quantitative characterized columns. For the Qualitative Columns, the primary columns include items relevant to a job posting, such as the ID, title, type, and level, along with the required skills for the job. For the quantitative columns I will be looking at attributes such as
- dates of job postings,
- minimum experience level requested in years,
- minimum and maximum salary offered for the job posting,
- and the number of applicants that applied to the job in the first 24 hours.
EDA questions to ask
- What is the average salary in data science?
- What are the most popular jobs in data science?
- Which data analytical skills correlates to job postings
- How frequent are job postings being posted (i.e. trends in job postings)?
Initial EDA with Power Query
We can observe that there are fewer than 1% of empty data for Company Name by hovering over the header title.

We can observe that the minimum pay, maximum pay, and pay rate columns have a lot of empty values, with over 90% of the values void. The number of applicant columns has 31% empty columns, Company name, Company Industry, and Company Size have less than 1% empty columns, and Job title additional information column has 70% empty columns.


Job posting trend analysis
- We'll visualize the average of Years Experience required by each of the fields of Job Position Level to have a first understanding of the relationship between time and position level.
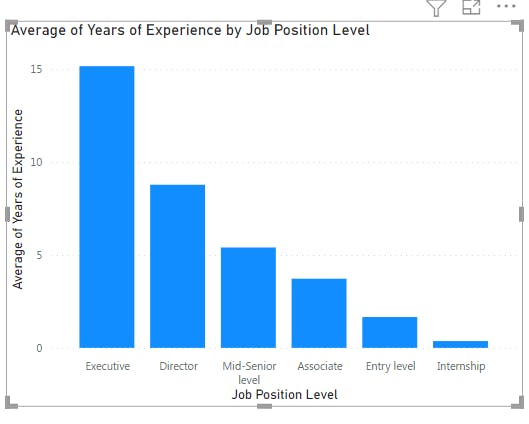
The higher the level of experience, the higher the work position, implying that you must have a particular amount of experience to reach various levels.
- Exploring trends in job postings over time, with a special focus on how years of experience relates to specific job positions (e.g., entry-level). Looking at what month and year has the least amount of job postings?
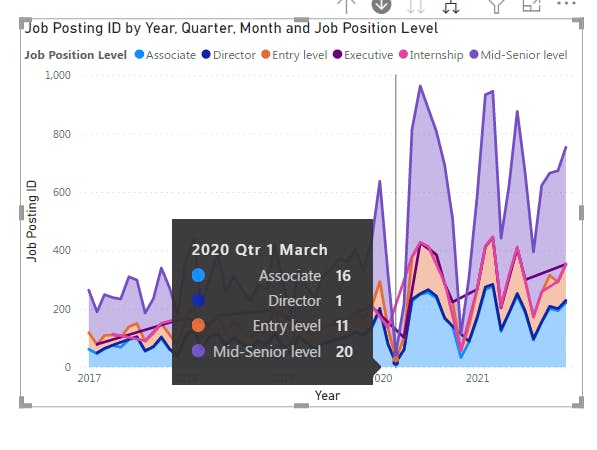
The month of March 2020 had a considerable decrease in job listings. Due to the commencement of COVID-19 in March 2020, this occurred. During these uncertain times, employers were hesitant to publicize job openings.
Data Cleanup of Job Titles
Data Scientist, Data Analyst, Data Engineer, Machine Learning Engineer, and Data Science Manager are among the top positions in data science that Data Search has requested a detailed investigation of. We are going to drill down the particular job of interest and answer some questions
- How many job postings are listed for the second highest number of jobs for the filtered values?
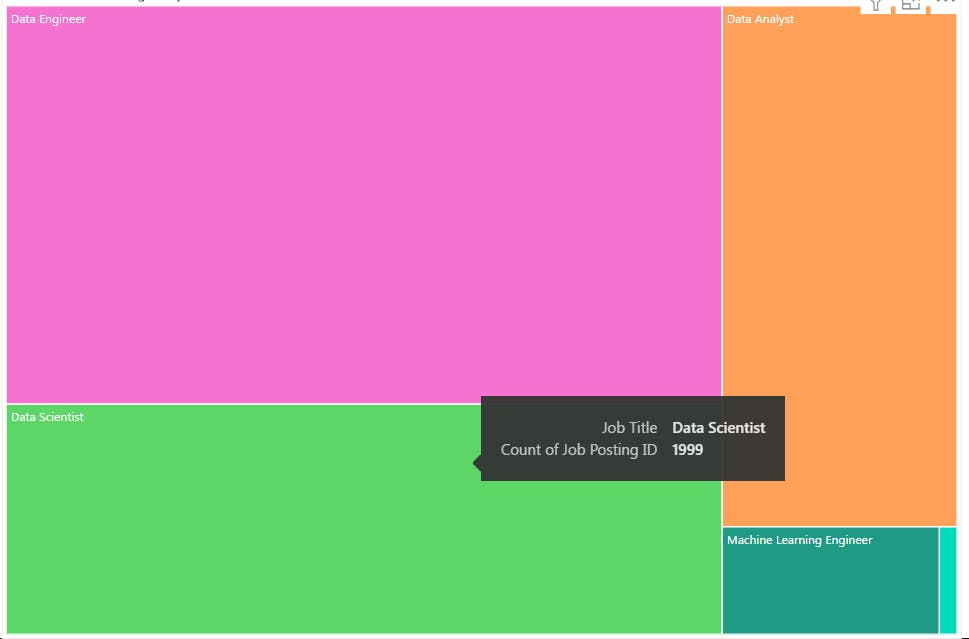
The Data Scientist position has the second most job openings. Surprisingly, data engineers appear to be one of the most in-demand careers in data science.
Effect of years’ experience on salary
Exploring the factors that influence employment market trends. For this, we'll look at salaries for various jobs and see how they vary with years of experience.
- Which
Job Titlehas the lowest average pay based on experience level?
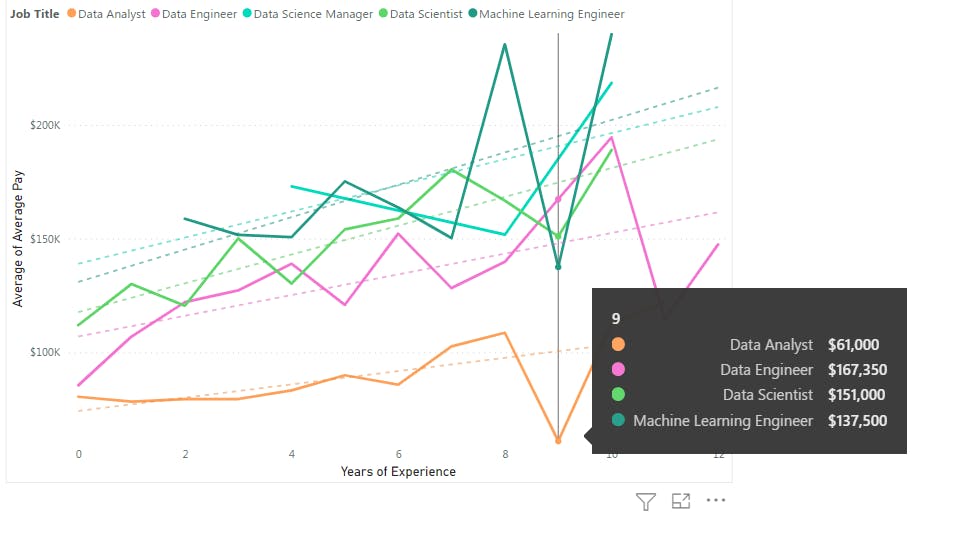
Data Analysts have the lowest salary!
Trends found with EDA
- There are many empty values for the salary information
- As years of experience increase for a job, so does the associated salary
- Job postings over the past five years are trending upwards
- There’s correlation between job position level and years of experience for a job
- Data Engineers is the most popular and in demand role in data science
Market insight analysis
Exploratory data analysis findings
The first is that the number of job openings is increasing with time. With the exception of a few brief moments of decline in job postings in 2020, job postings for data science positions are on the rise, which is great news for DataSearch. Data Engineers, Scientists, and Analysts are among the most in-demand positions among the five to examine. To optimize our efforts, we'll want to concentrate on these tasks in our next examination. Finally, we highlighted that data science positions are in high demand in the technology industry, and that these professions all pay well and are growing in demand. We'll need to dive more into these industries and companies in the upcoming analysis.
Diving deeper into the dataset
Although we were able to do a high-level analysis of all of the data earlier, we will now go deeper into some of the columns displayed to unearth additional insights. We'll use compelling visuals to help us create these discoveries. We want to see whether there's any link between skills and a certain job title. We'll also look at the top industries and companies that are looking for these positions. Finally, we'll make suggestions to stakeholders based on our results, so we'll be looking for relevant insights to offer.
Key insights to focus
• Are certain companies targeting particular job types, experience, or skills? • Is there a minimum expected experience level for certain roles or skills? • What are top skills needed for entry level data scientist? • What industries have the most competitive salaries
Cleanup and skill analysis
The Job Skills column contains values in a list (e.g., ['python', 'power_bi', …]), so we'll need to clean this up before further analysis.
- Duplicate the current job posting table.
- Renaming the duplicated column to be job skills and removing all columns except Job Posting ID & Job Skills
- Clean up the Job Skills column to remove brackets (e.g., []), quotes (e.g, ''), and spaces (e.g., " "). Only the comma is remaining as the delimiter.
- Splitted the Job Skills column by the delimiter to make a row for each skill along with the associated Job Posting ID.
- Removed the rows that had blanks value in the Job Skills column by using the down arrow in the header of this column.
Creating a visualization showing the counts of all the different skills.
Looking specifically at power bi, it looks like Power Bi is categorized under two entries powerbi and power_bi, so It’s necessary it’s uniform. Replacing every instance where there’s “powerbi” to “power_bi”
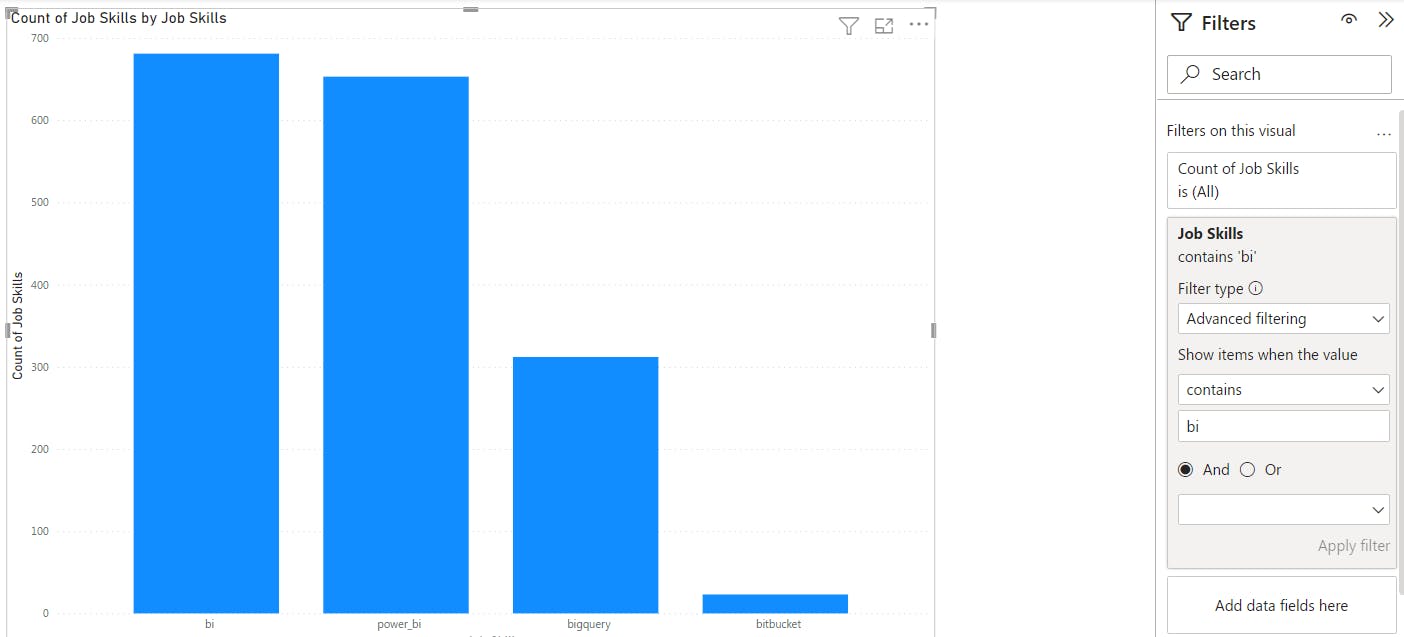
Likelihood of skills in job posting
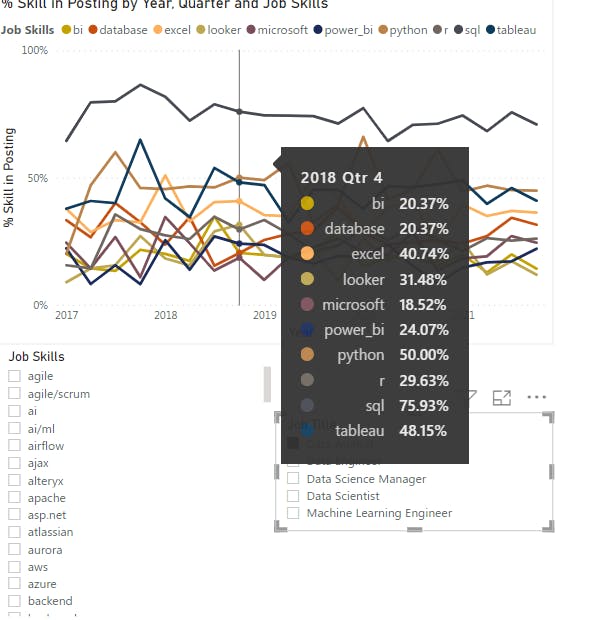
Using DAX to better understand the likelihood of a particular skill being featured in a job posting. We create a measure called posting counts that counts the job posting ids, as well as a measure called skill count that counts the number of skills, and then we calculate the ratio (skill count / posting count) = %skill in posting.

Python is a top skill of Data Scientists, Data Science Manager…
Trends in skills over time
Exploring how skills in job postings trend over time. For the three major jobs (i.e., Data Analyst, Engineer, & Scientist) we can see the metrics have fluctuations on a short-term basis, they seem to maintain relatively consistent over the past few years.
Deep dive into key job descriptions
For DataSearch, we're going to go further into the top companies and industries that are hiring data scientists. Using a visualization that includes both Posting Count and Job Position Level, we'll filter down to the top 10 industries by number of job posts. Looking specifically at mid-level roles for the internet industry
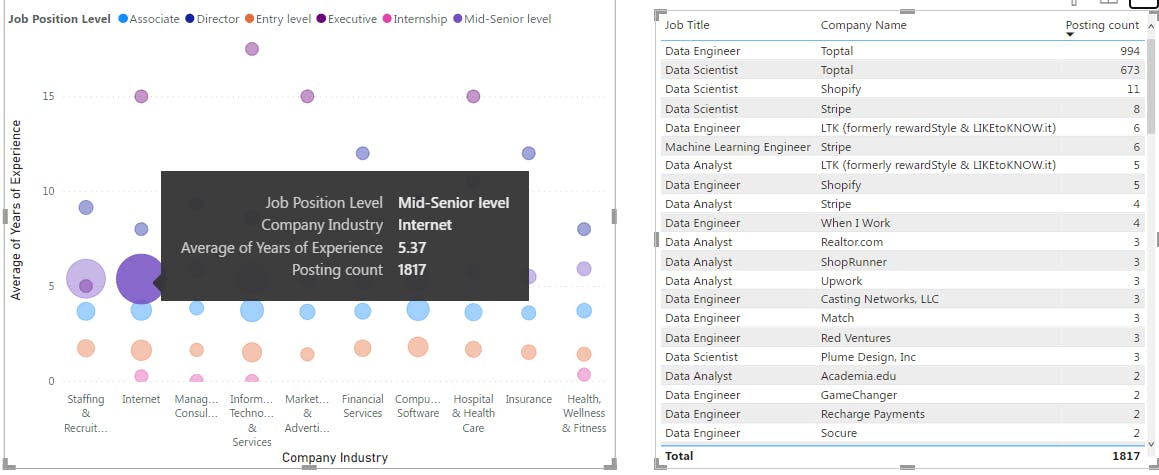
This company (topal) appears to be employing a large number of Data Engineers and Data Scientists. This is an important discovery to offer to Datasearch!
Other Job Recommendations
Other job titles that have similar requirements to the 5 key job titles we looked at earlier should be considered. For example, looking at what job is most similar to a data analyst in terms of the type and number of skills required, we can see that both business analyst and data analyst require SQL, Excel, Tableau, database, and cloud skills.
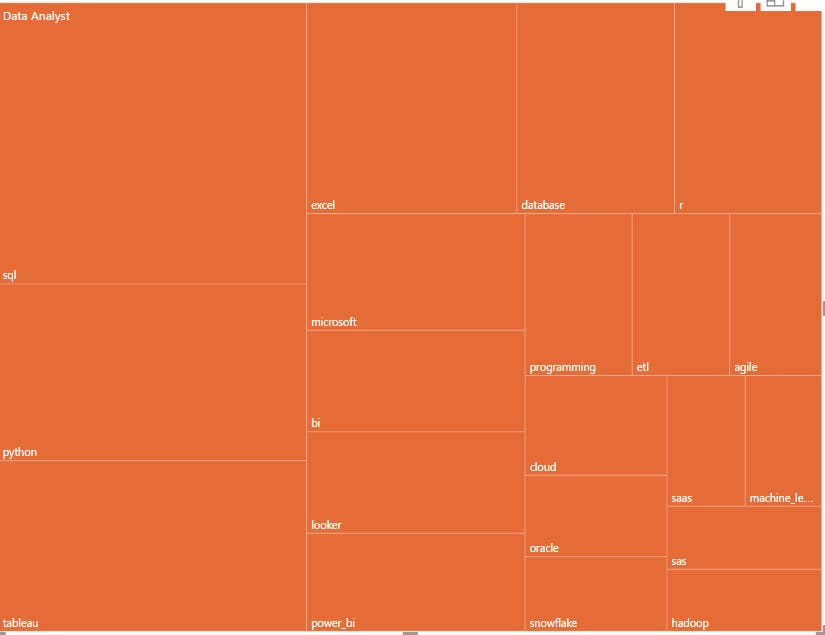
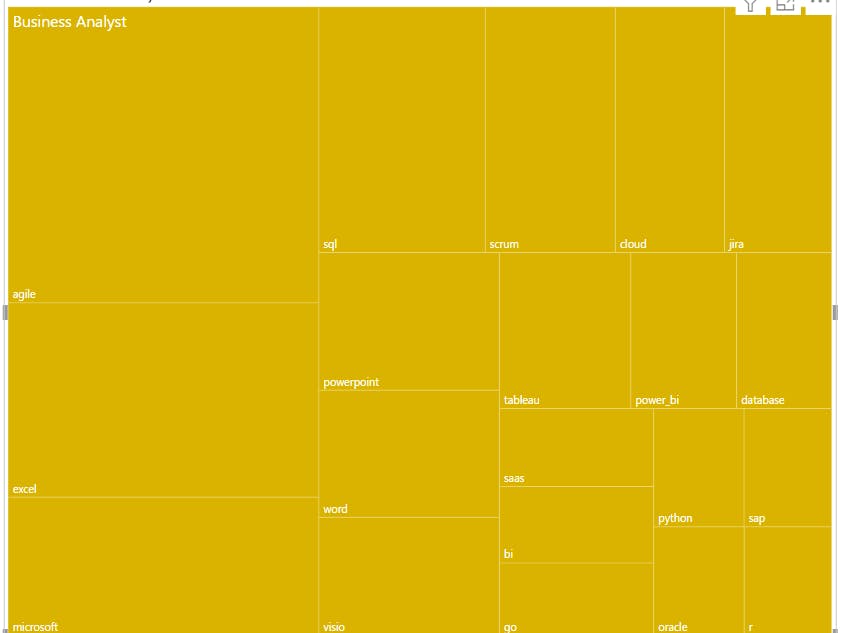
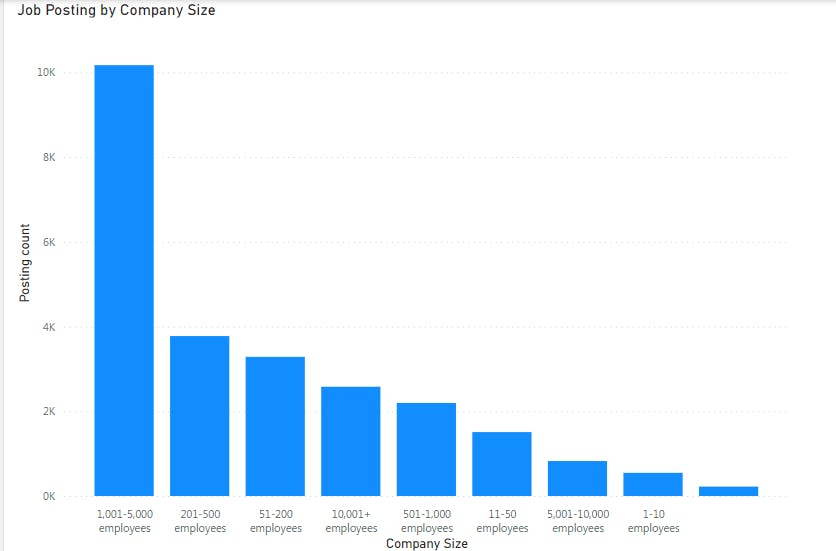
Job Posting by Company Size
Most job postings came from smaller sized companies
Begin Dashboard Template
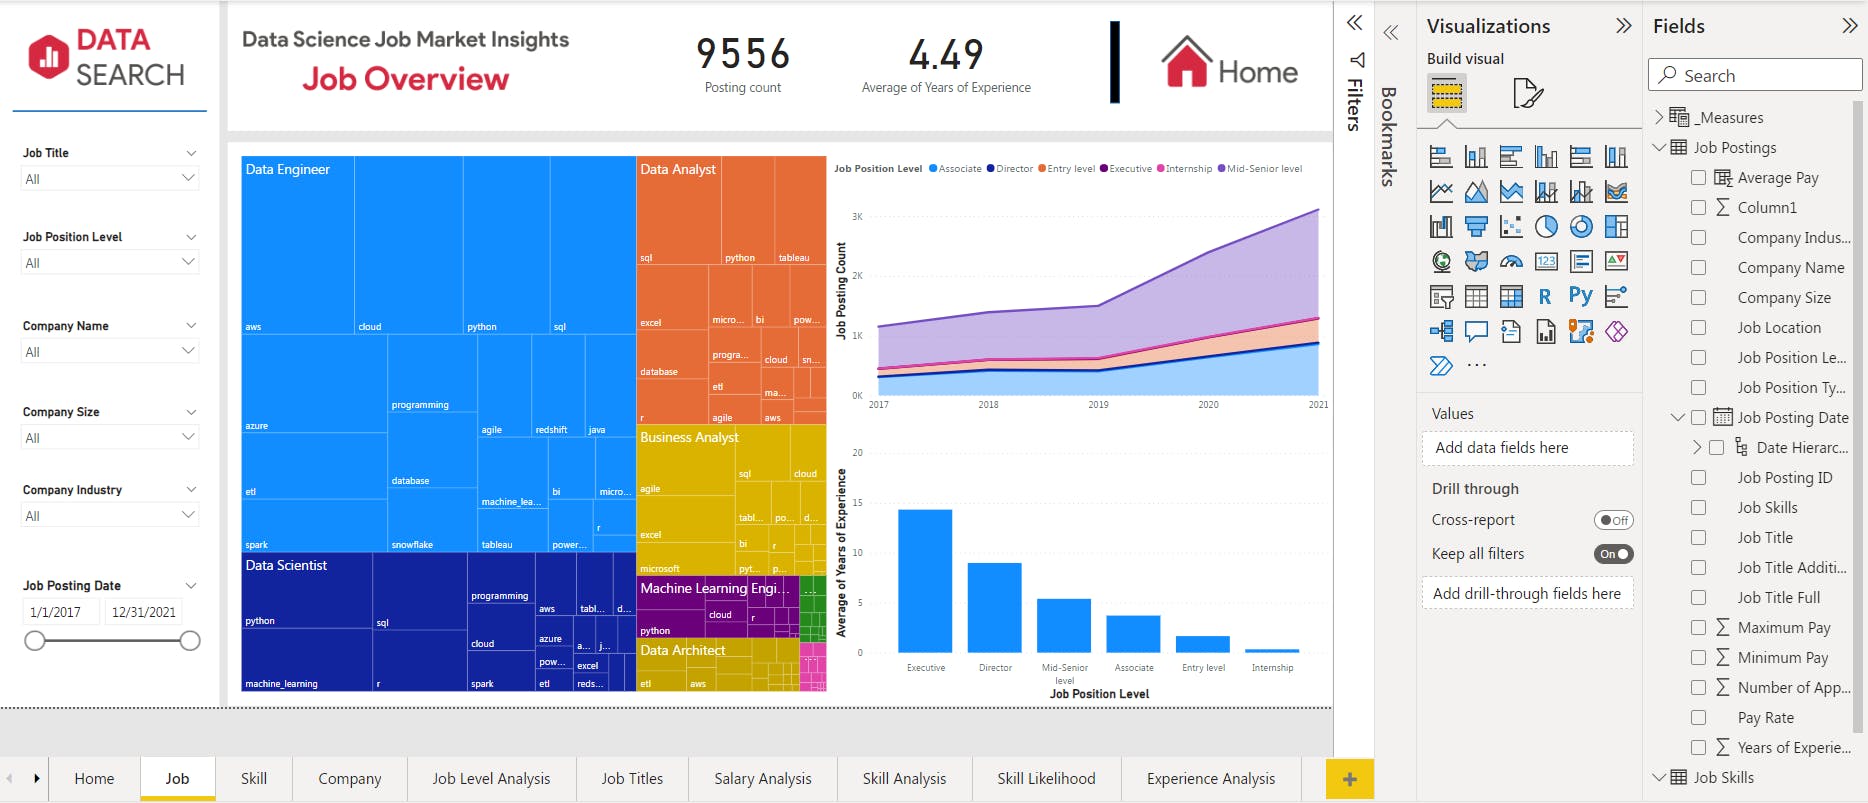
I'm going to start by adding visuals to the dashboards; our slicers will be on the left, we'll have a header, and the charts will be below.
What job position for the level of business analyst request excel the most as a skill
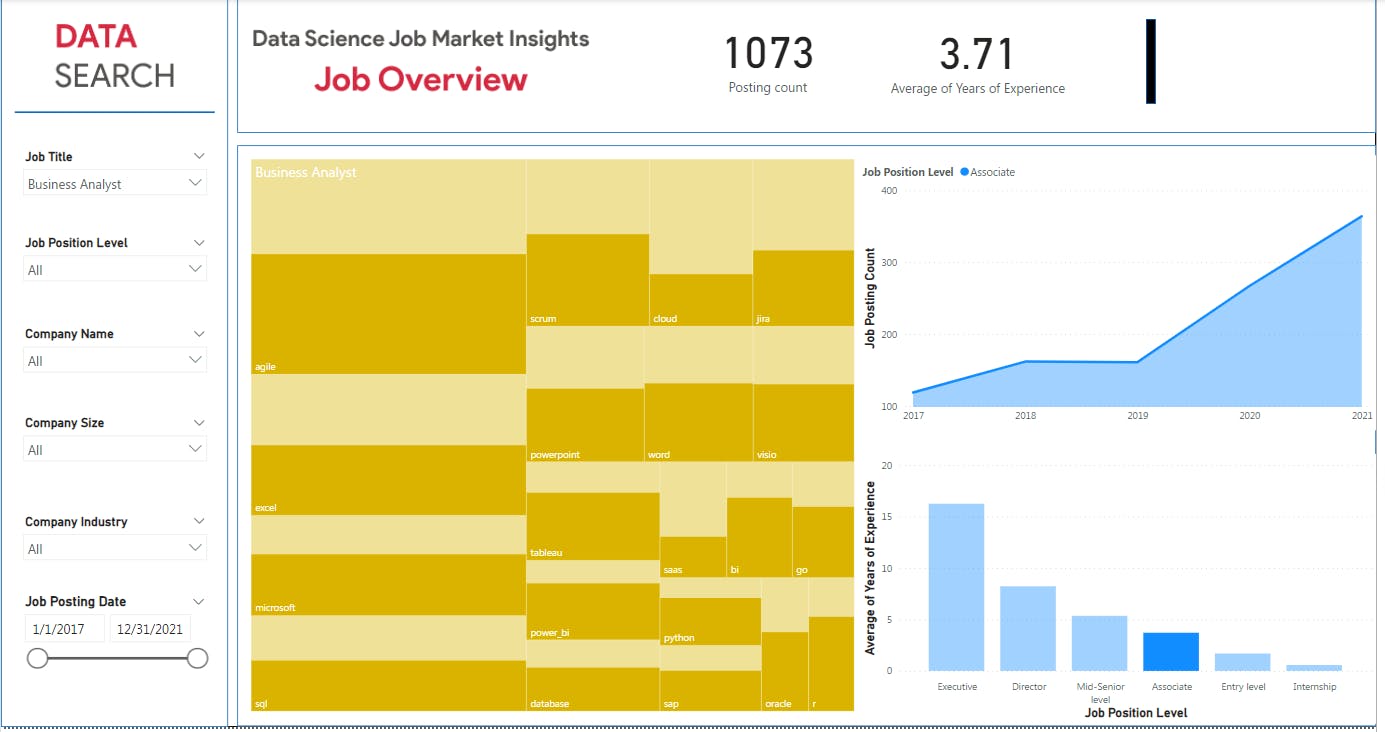
There are 269 postings for the associate business analyst requesting excel as a skill
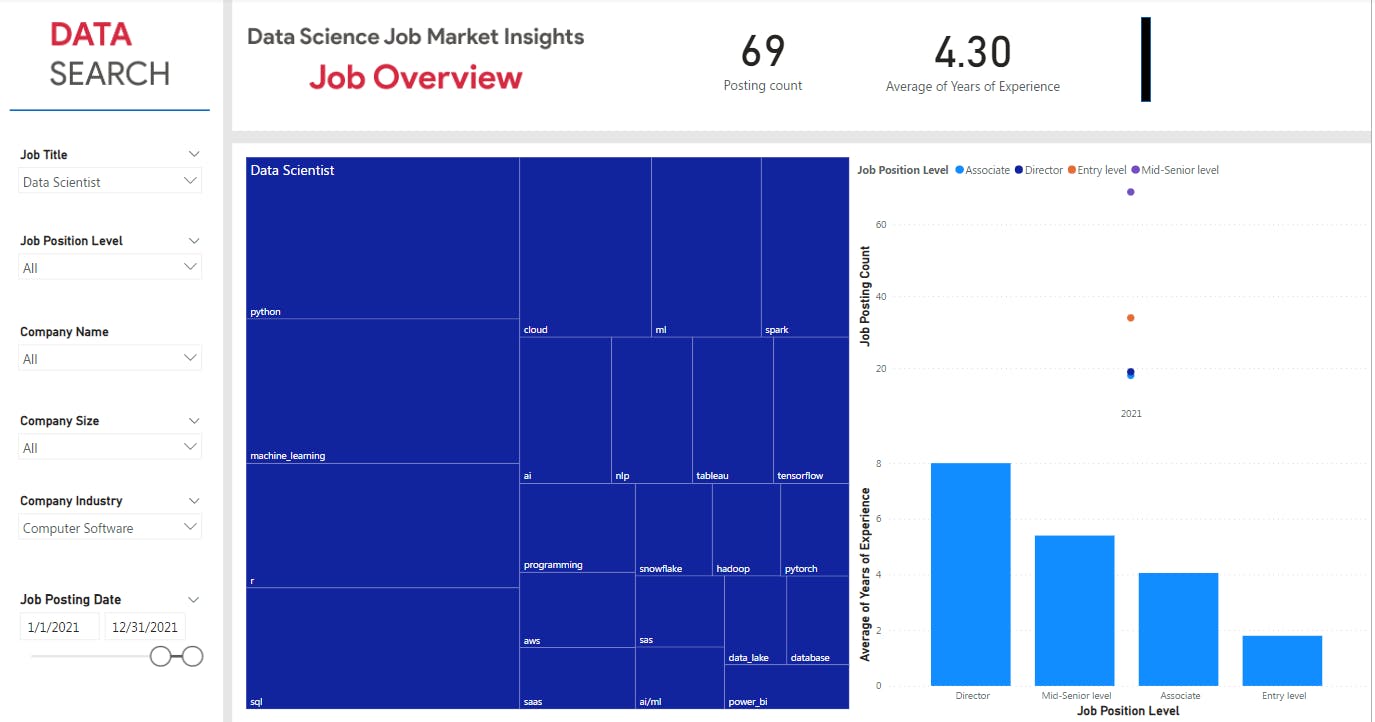
Checking if the slicers are responsive, we could answer the question, that in 2021, what was the average years of experience for data scientists in the computer software industry
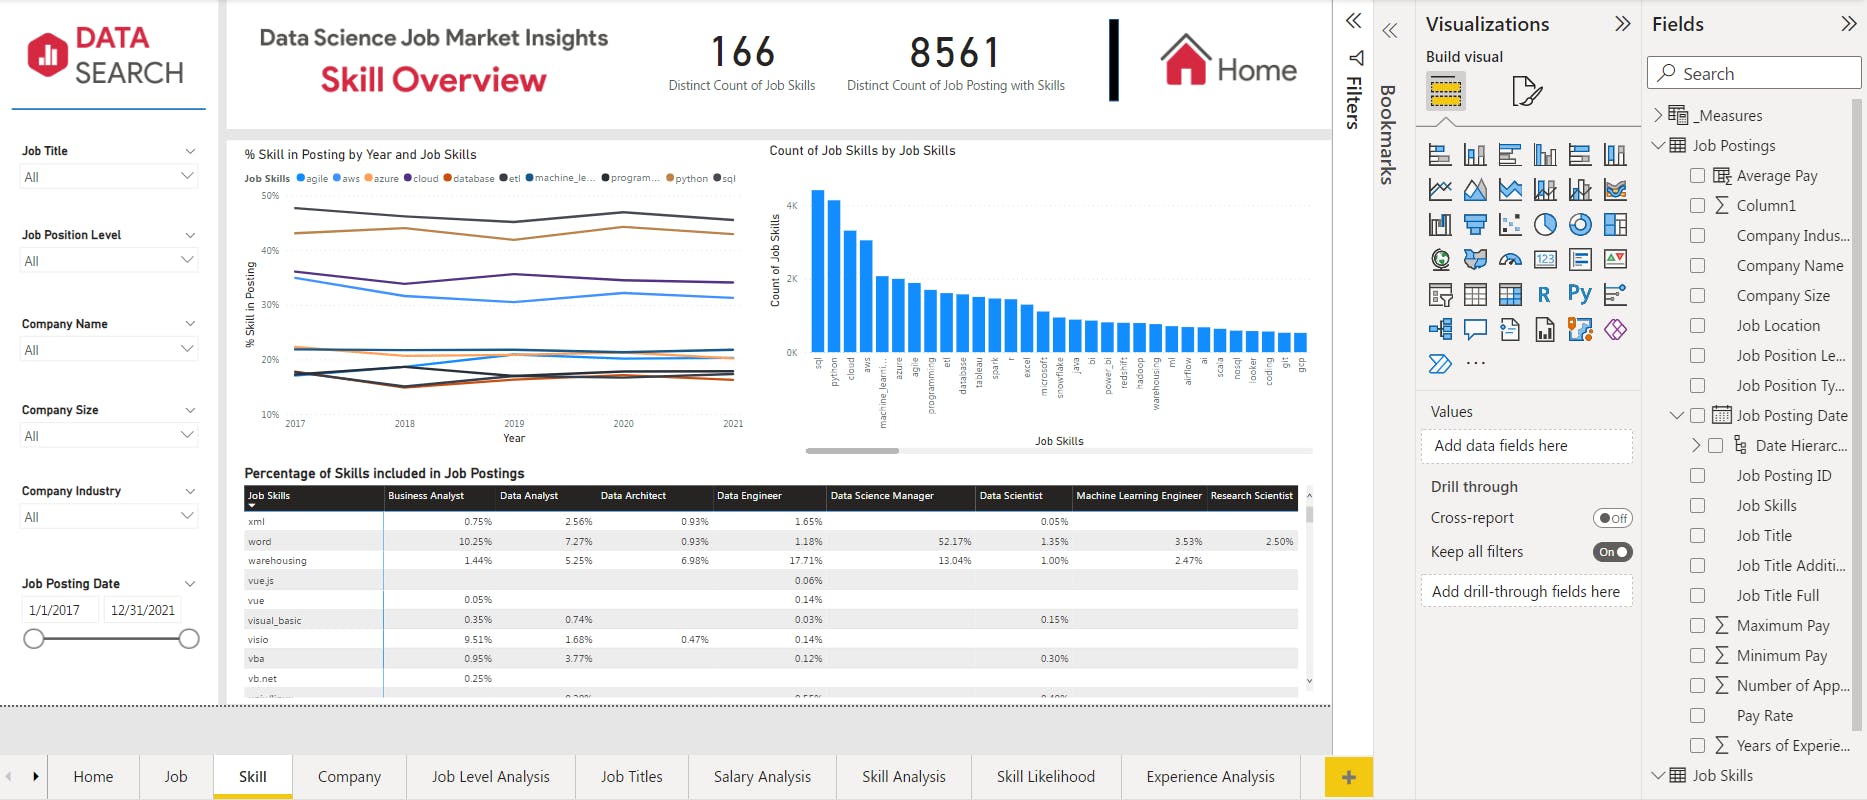
Next is completing the skill dashboard, by including visuals from the skill analysis and skill likelihood pages. To verify if the cards are working, we might ask questions like how many job postings for a data analyst list the expertise of SQL. 1425
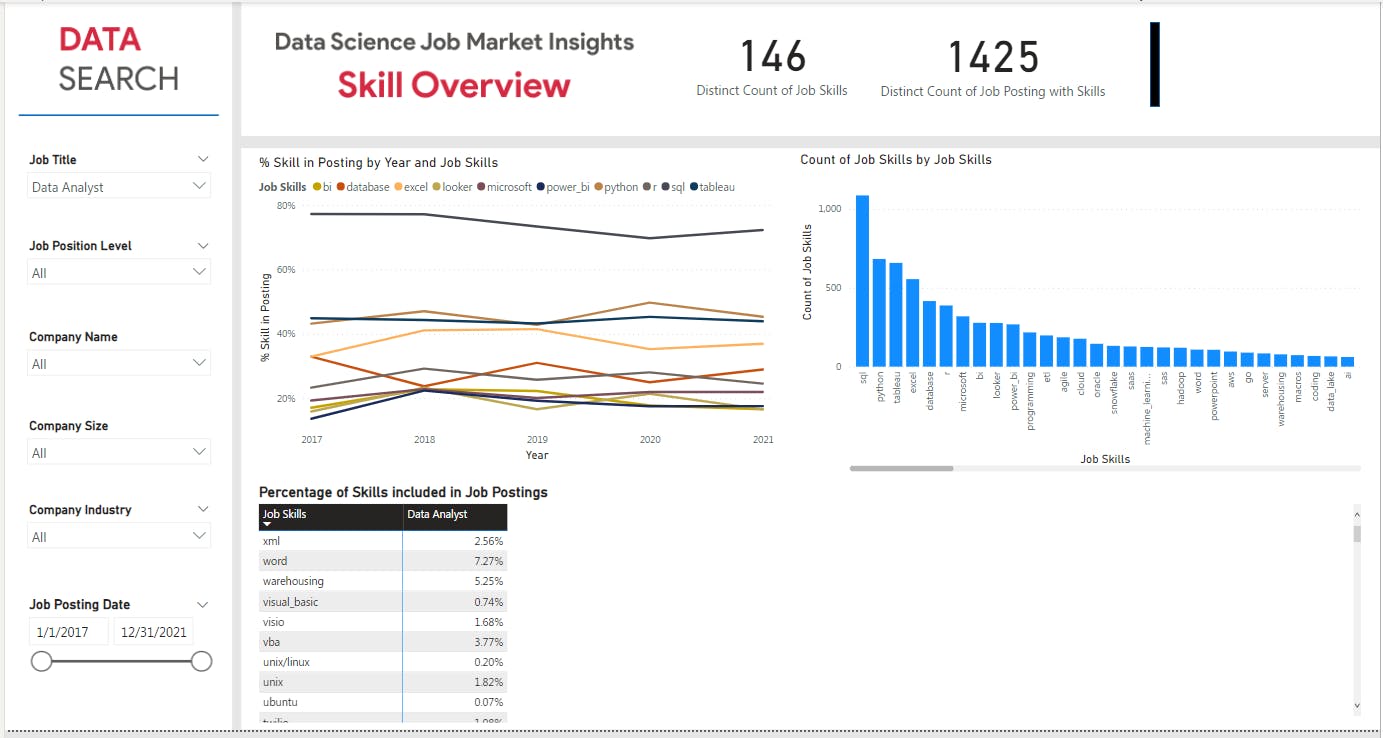
We have been able to verify that the cards are working properly
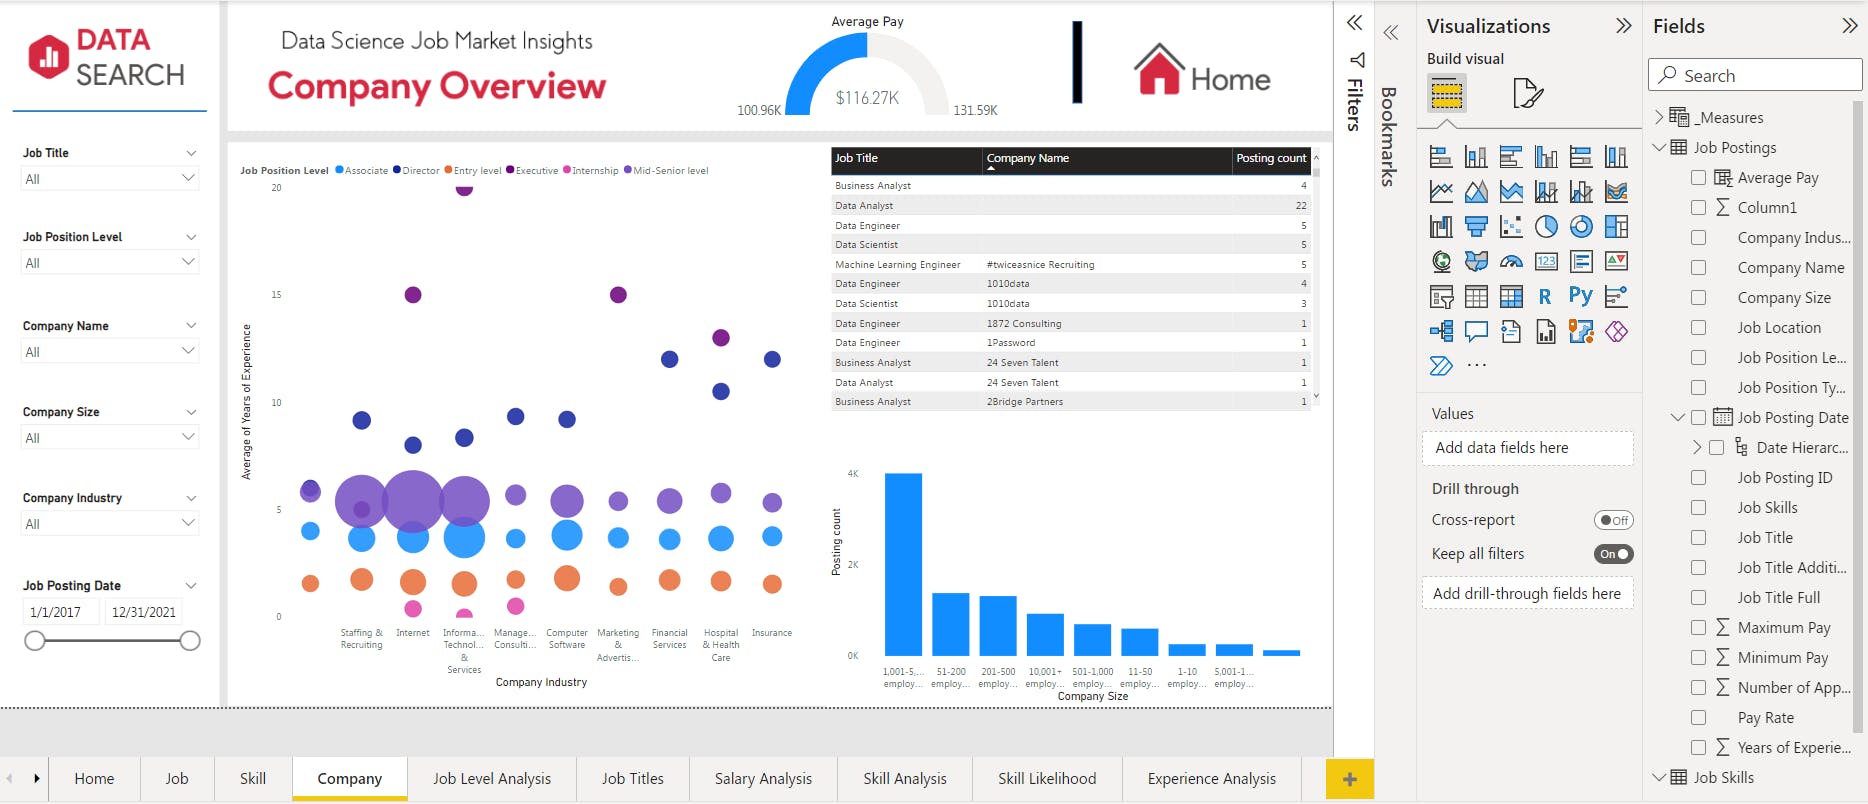
The third dashboard would contain a gauge for the salary, we would also need all the visuals from the “Experience Analysis” page. The gauge includes average pay at the value, average minimum pay at the minimum, and average maximum pay at the maximum. To see if the gauge works, we may ask questions such, "What is the typical compensation for an entry-level data scientist in the computer software industry?"
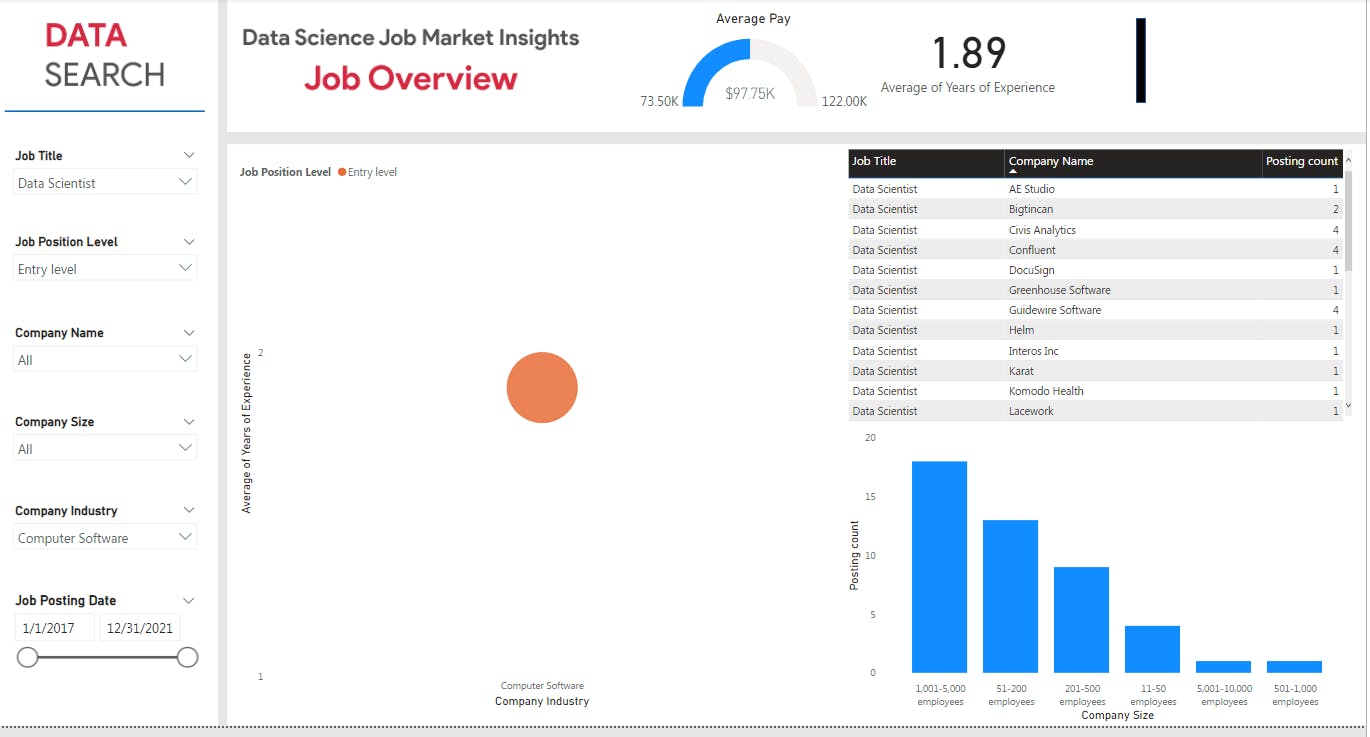
The average pay is $97.75K. We may look at companies and their pay using this visualization.
Wrap Up
I have completed all major portions of the data analytics pipeline. I progressed from integrity checks and exploration to identifying insights in the data science job market. In addition, I created an interactive dashboard for DataSearch to utilize in future recruiting! This final dashboard now helps with communicating insights. Recruiters using DataSearch can now simply search for data science jobs to better tell their customers about the most in-demand roles, skills, and companies!
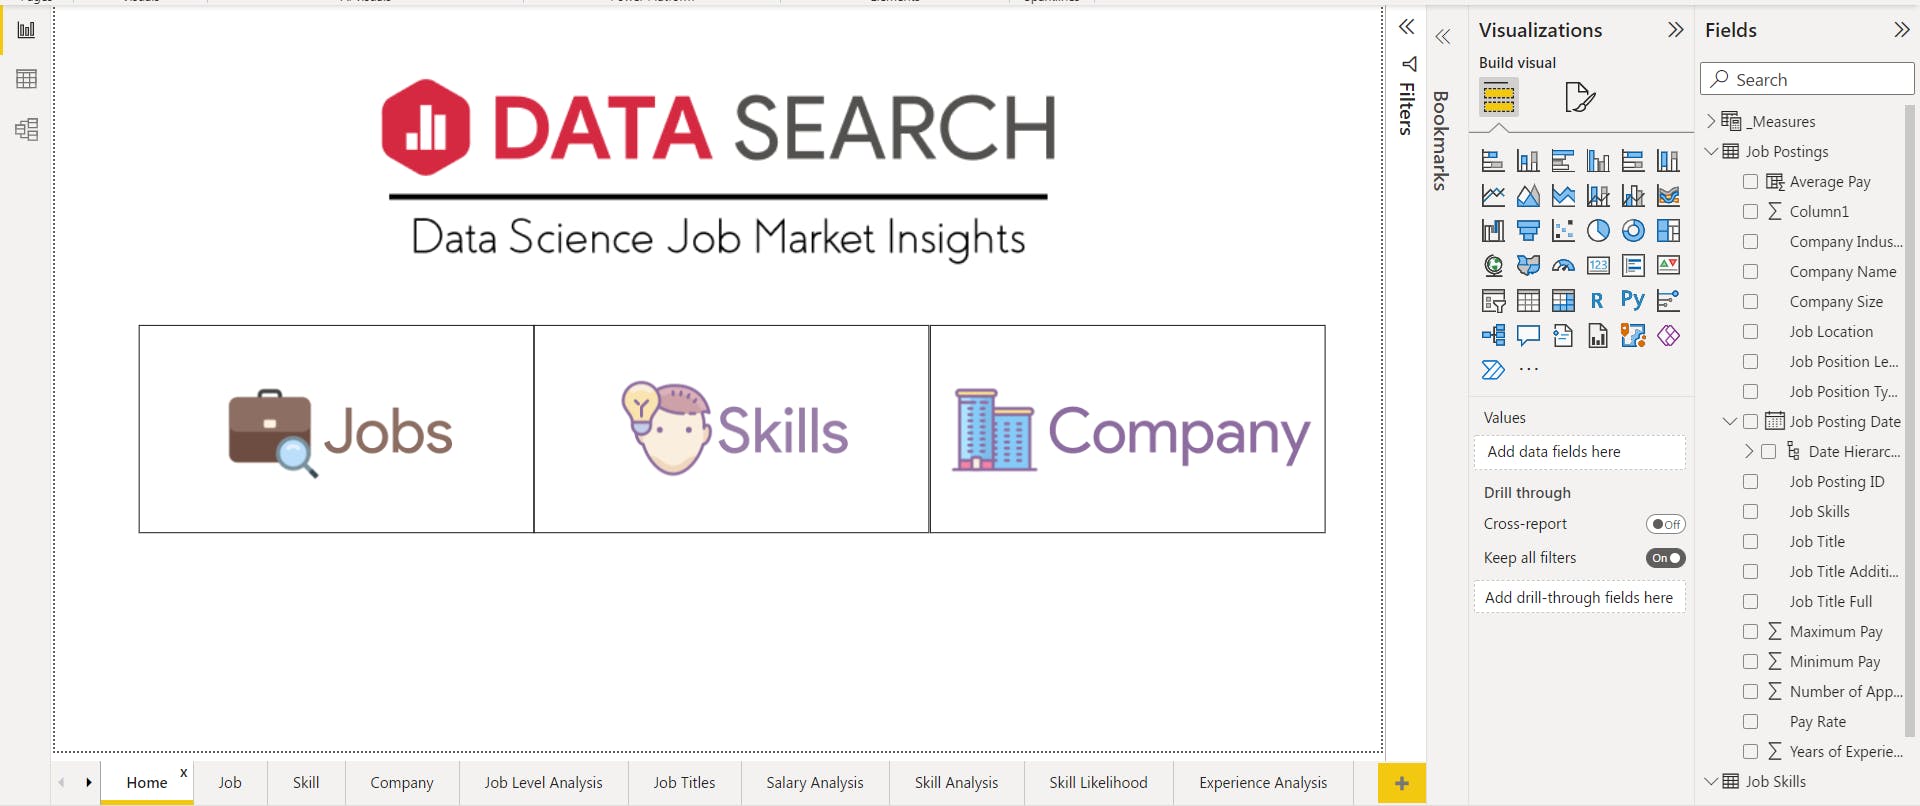
Snapshot of dashboards below
Thank you for reading.

